Help Center
What are the metrics widgets on the Dashboard?
The metrics widgets on the Dashboard allow you to have deeper insights on the performance of your online listings.
Tip: You can hover the mouse on the “i” icon next to each widget to get a short explanation about them.
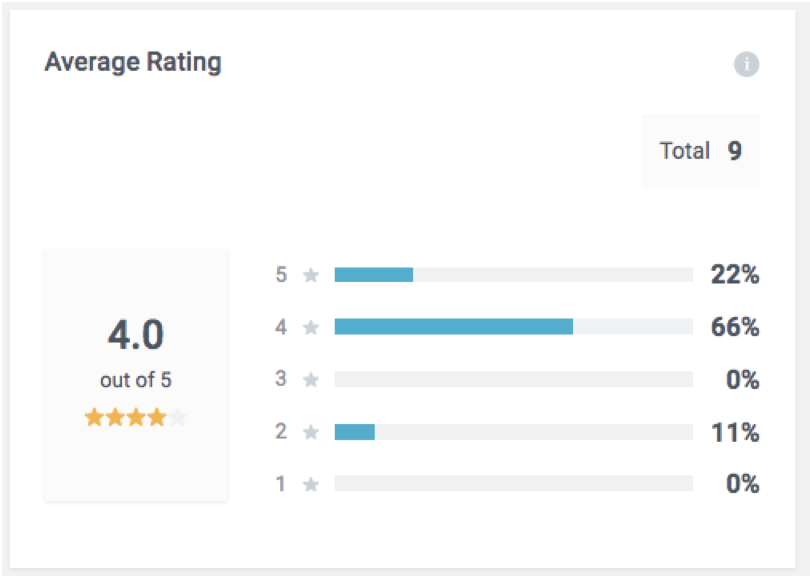
Average Rating
The average of the customer feedback including a star rate. This is what you see if you have multiple locations and are in the global dashboard overview:
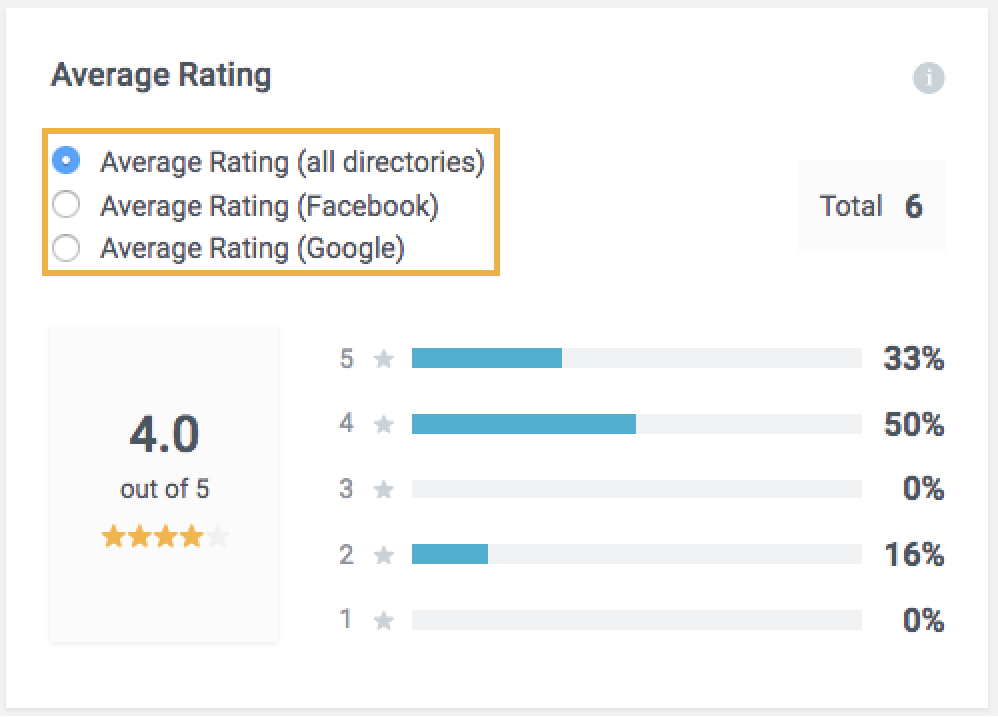
Average Rating per Directory
When you have several locations, once you access a specific location’s dashboard, you will be able to choose to view the Average Rating per directory (Facebook/Google):
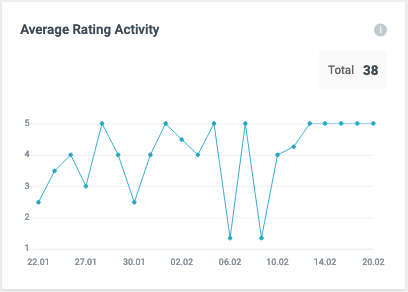
Average Rating Activity
This widget presents a graph with the evolution of the average rating received in reviews for a certain time range selected:
Reviews Analysis
Displays the list of top 100 words mentioned in reviews with the corresponding percentage and average rating of reviews containing that word.
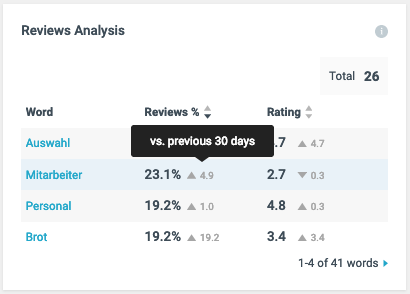
– For further information about this particular widget, you can read an article about the feature called Smart Insights for Inbox.
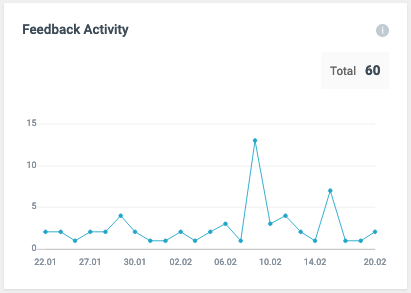
Feedback Activity
Represents all customer feedback over time, including those without the start rating functionality.
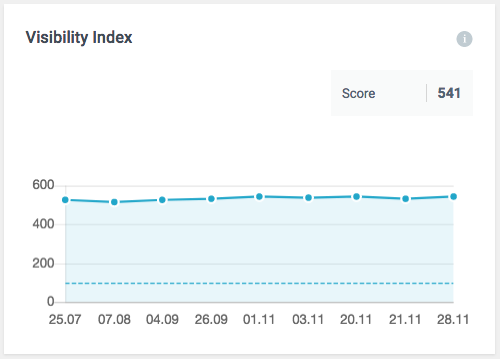
Visibility Index
Still on the location level, you will also see the Visibiility Index, which is calculated by the number of identical data fields when comparing the current profile and the listings on the directories pages. The score gets higher as the profile information increases.
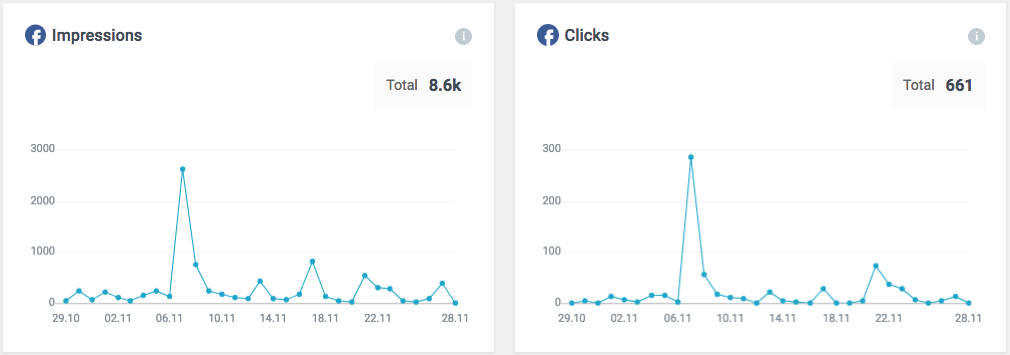
There are two widgets that display data regarding Facebook:
- Impressions: The number of times any content from your Page or about your Page entered a person’s screen. This includes posts, check-ins, ads, social information from people who interact with your Page and more.
- Clicks: The number of times people clicked on any of your content published on Facebook.
The last 4 widgets show more granular data specifically to Google:
- Impressions:
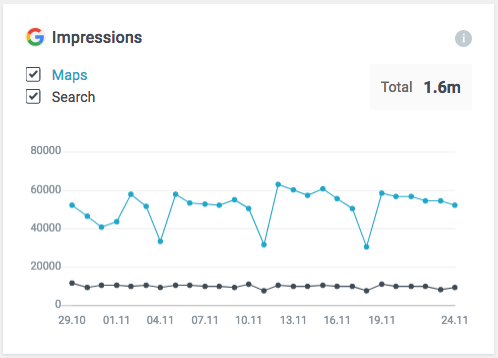
- Maps: The number of times the resource was viewed on Google Maps.
- Search: The number of times the resource was viewed on Google Search.
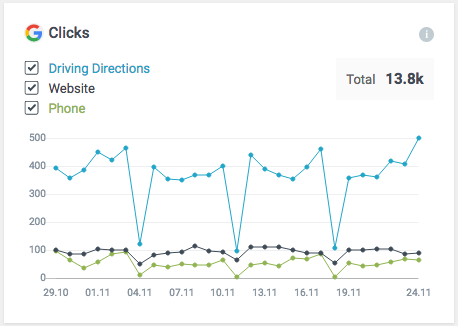
- Clicks: this section shows what customers did when they found your listing on Google. It gives the total of the following actions taken by the customers:
- Website: The number of times the website was clicked.
- Phone: The number of times the phone number was clicked.
- Driving Directions: The number of times driving directions were requested.
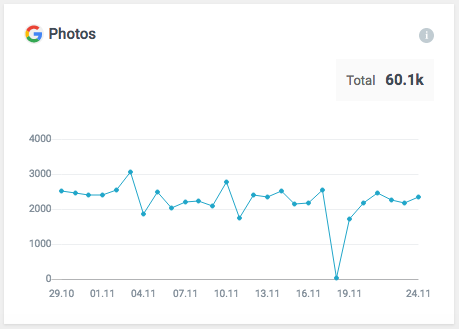
- Photos: the graph shows the number of times your photos (uploaded by the merchant) were viewed by Google users.
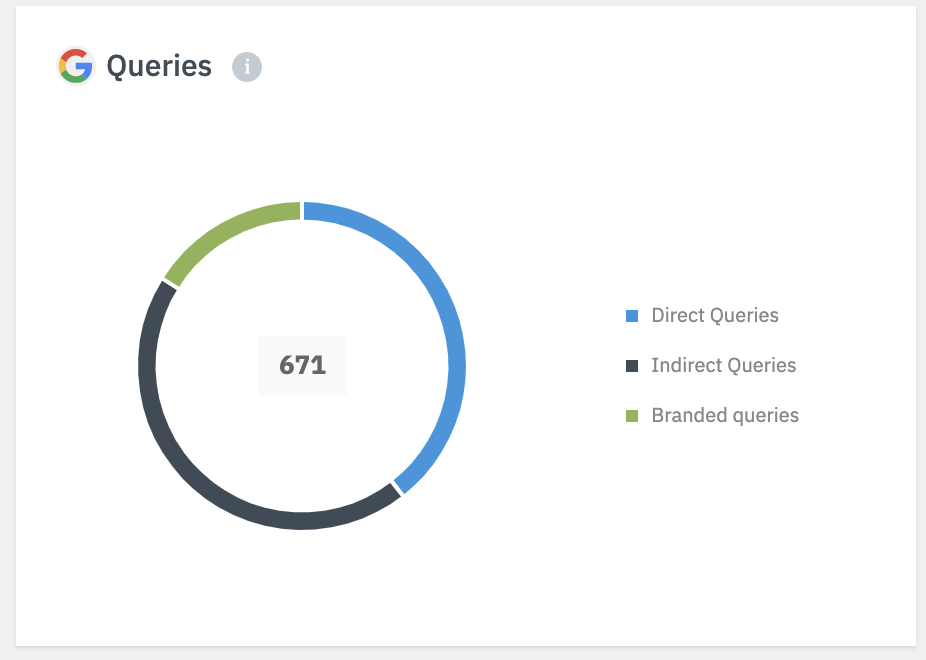
- Queries: this section shows how many customers found you in a “Direct” search versus an “Indirect” (discovery) search:
- Direct: the number of times the listing was shown when searching for the location by typing your business name or address;
- Indirect: the number of times the listing was shown as a result of a categorical search (for example, restaurant).
- Branded Search: the number of times the listing was shown as a result of a search for a specific brand
Additional Functionalities
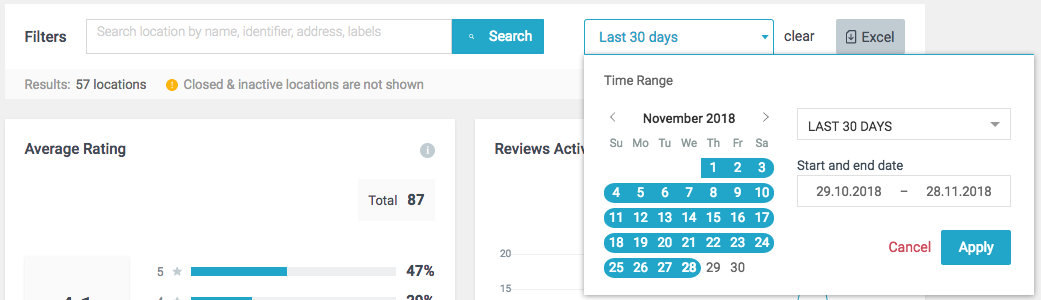
All the above metrics can be filtered by: location name, address, ID and label or by time period, and exported as a csv (Excel) file:
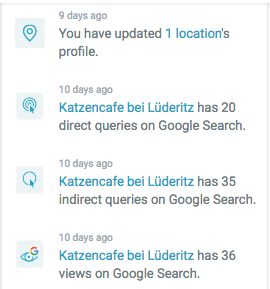
All those metrics also show up individually in the dashboard (activity) feed, on the right sight of the page: